By the end of this unit you should:
Read.
It is necessary to identify the tenses and time expressions in a text prior to visualizing those features. There are two main methods for identification namely rule-based parsing, such as using regular expressions, and probabilistic parsing, for which machine learning is used. Once the features are identified, the system designer needs to decide whether to visualize the features within the text or extract those features and display them in a different format. In-text visualization can take many forms, some of which include inserting labels or emoticons, colorizing the background or text, and changing the font size, type or weight. Possible ways to visualize tenses and tenses in different formats include charts, graphs and tables.
Read.
Company reports and newspaper articles frequently present the quarterly and annual sales results using graphs. A hot topic in natural language processing is automatic graph generation.
Consider the following sentence:
The share price for UOA industries rose by 5% this quarter to close at 4567 yen.
From this sentence we can extract a lot of information needed to create a graph visualizing this sentence, namely:
From only one simple sentence, we can create a simple straight-line graph. However, to do so we need to extract the relevant data and values to complete the necessary cells in a table that can be used to create a graph.
Read
Generating text from graphs is a particularly interesting challenge. Top-tier English language tests, such as IELTS and TOEFL, test candidates ability to describe graphs and charts. Candidates are presented with the graph and need to write the corresponding text. To provide students with practice for this activity, a program that could automatically generate text for any graph would be helpful. Then, students can compare their writing with an automatically-generated model.
To automatically generate text, the system needs to identify:
Let's consider the task of visualizing the changes in sales of Taiwanese bananas to a supermarket last year. The sales are reported each month. Time periods can be reported in months or quarters. The highest and lowest points of the graph also need to be known.
To automatically generate text, the system needs to identify and generate:
How would you try to solve this? One approach could be to identify the values and terms needed, then write functions to extract and store the data, and finally create a function to plot the graph. Easy to say, but how difficult is it to do? Using a language and any libraries you are familiar with, have a go.
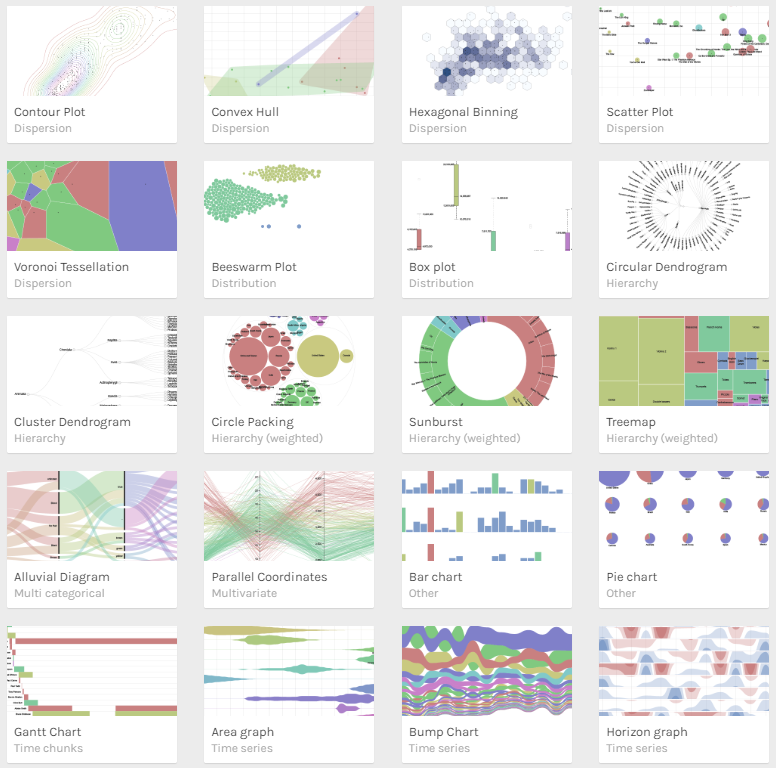
Access the Rawgraphs website here. Start by using one of their sample datasets. Select a chart time. Then, drag and drop the elements to map the dimensions, and customize your visualization in the final section. Try out a number of the 21 types of charts available.
This activity should give you an idea of how powerful data visualization is, and the wide choice of charts.
Watch and listen to a short explanation of Tableau
Tableau public is the free version of Tableau, but comes with some restrictions. However, for the purposes of this course, it is possible to use Tableau to create your visualization prototype.
Look through this code to see how their logic works, and run the code. If you find anything interesting, share it in the discussion forum.
For those who are interested in their SoPa (soft patterns approach which lies between RNNs and CNNS), check out this arxiv paper.
Watch and listen to a short explanation (4 min 33 sec) on how to make timelines in Python using labella and R using timevis.
Read the following.
Google charts can be used to visualize data online. Check out the introductory guide to Google charts here. Be sure to try out the "add interactivity". The chart below is created using Google charts.
Copy and paste a short newspaper article or story into Textexture to see the text visualized as a network graph.
This tool is no longer supported by the developer who now offers a pay-for-use out-of-the-box version and an open source version for those who can program. The open source version is available on Github here.
Create regular expressions to match common time expressions. You can use any programming language, but Python or JavaScript ar the recommended ones. This practice activity on w3schools is a good starting point if you are not familiar with Python. The code for regular expressions is simple, but regular expressions can look rather complicated. When developing a prototype from scratch you will almost certainly need to use regular expressions.
Explain in words (pseudocode) how to automatically generate a text from the table of annual banana sales is given below.
Month | Number of banana sales (million yen) |
---|---|
January | 2345 |
February | 4055 |
March | 3300 |
April | 3305 |
May | 2310 |
June | 3120 |
July | 2885 |
August | 5012 |
September | 4862 |
October | 3477 |
November | 2991 |
December | 1654 |
For example, to decide the trend or directionality: if the monthly sales value is greater than the previous, use "rise"; if the value is lower, use "fall", else use "remain steady". Other concepts to consider include:
Try out the three tense identification tools on the course tools tab. Compare and contrast the tools. Point out the benefits and drawbacks of each tool. Include the following:
Make sure you can explain the following 3 concepts in simple English:
Running count: 62 of 70 time-and-tense-related concepts covered so far.