|
This web page is prepared for providing research materials of our project on visual analysis of geospatial multivariate data for investigating radioactive deposition processes.
|
|
|
|
The 2011 Fukushima nuclear accident has increased awareness of the importance of the radioactive material deposition process, particularly in proposing aerosol countermeasures against air pollution.
However, due to the complex topography of the target area, it was difficult to understand the overall picture of such processes.
In this study, we conducted applied research to identify radioactive material deposition processes by utilizing visual interaction with topographical data.
The idea we propose is to visually investigate the correspondence between spatial location and the behavior of attribute values.
This involves creating a scatter plot that shows the relationship between attribute values, and interactively identifying the spatial location corresponding to the scatter plot, it is possible to find areas with specific radioactive deposition processes.
Our visualization technique can clearly distinguish contaminated areas caused by different deposition processes, and is useful for classifying deposition processes.
|
Results |
|
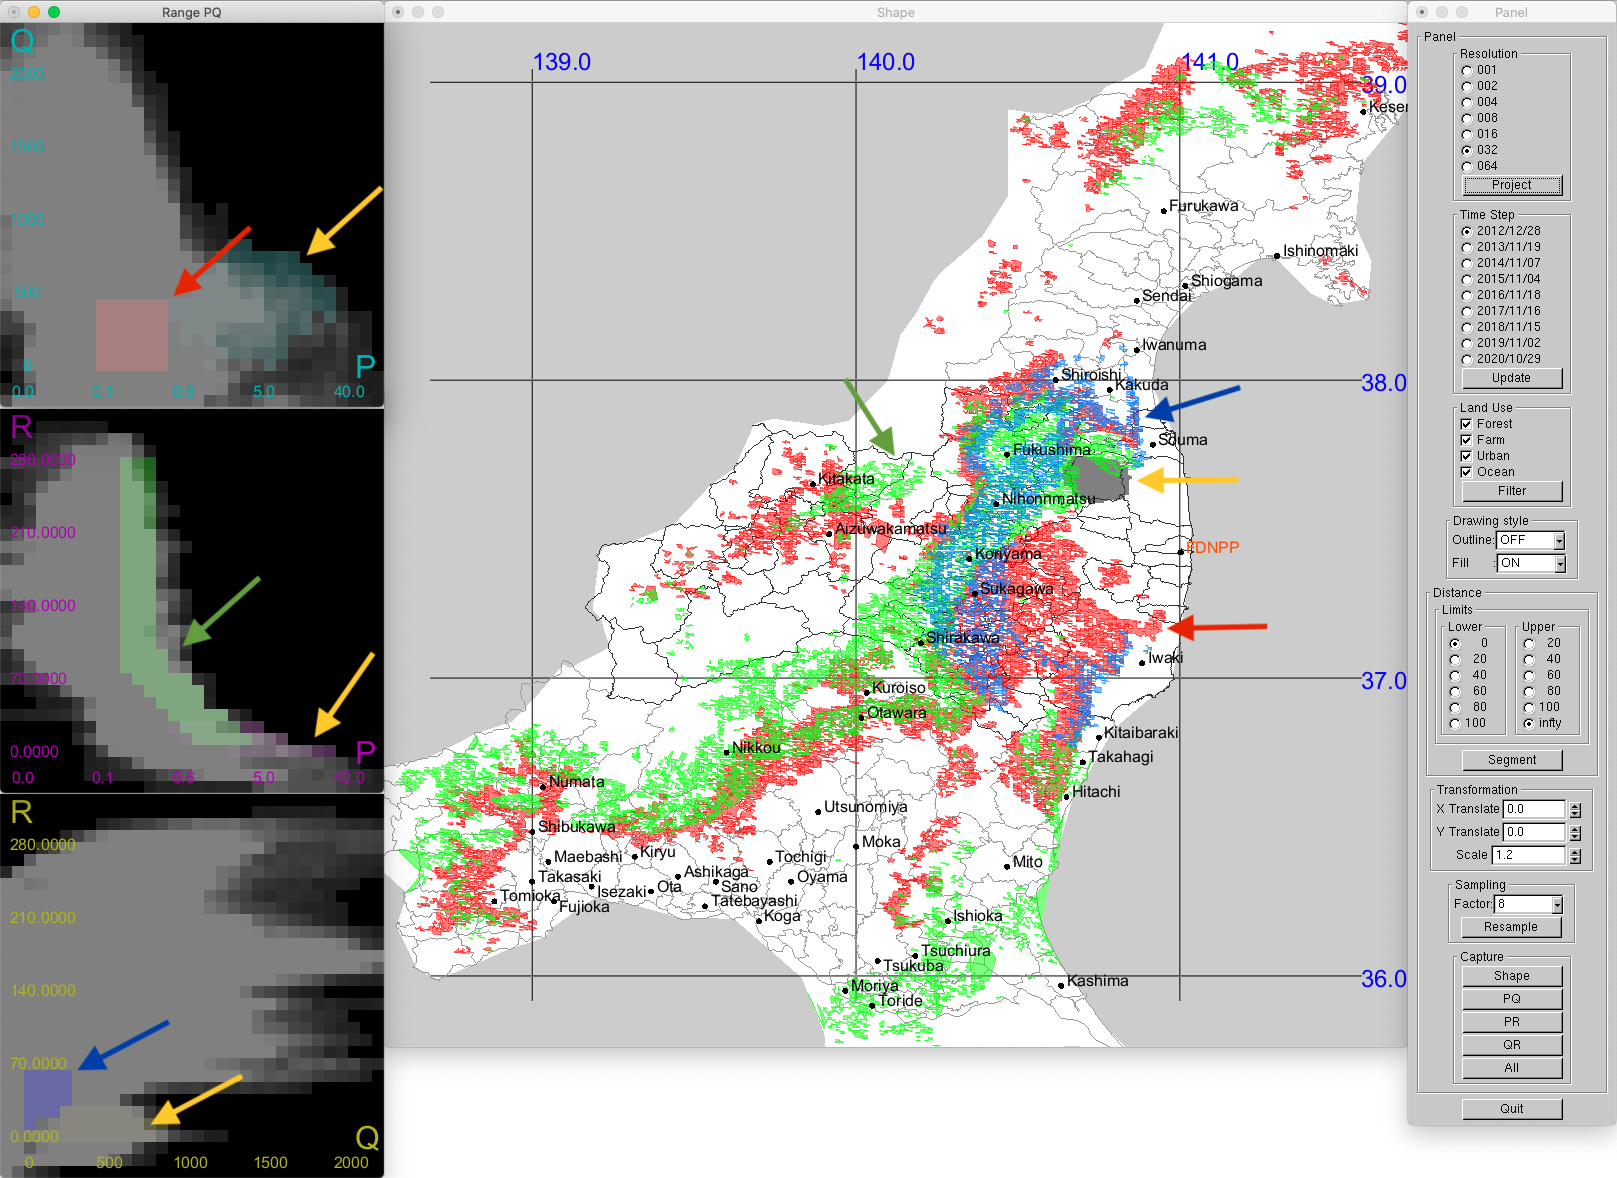
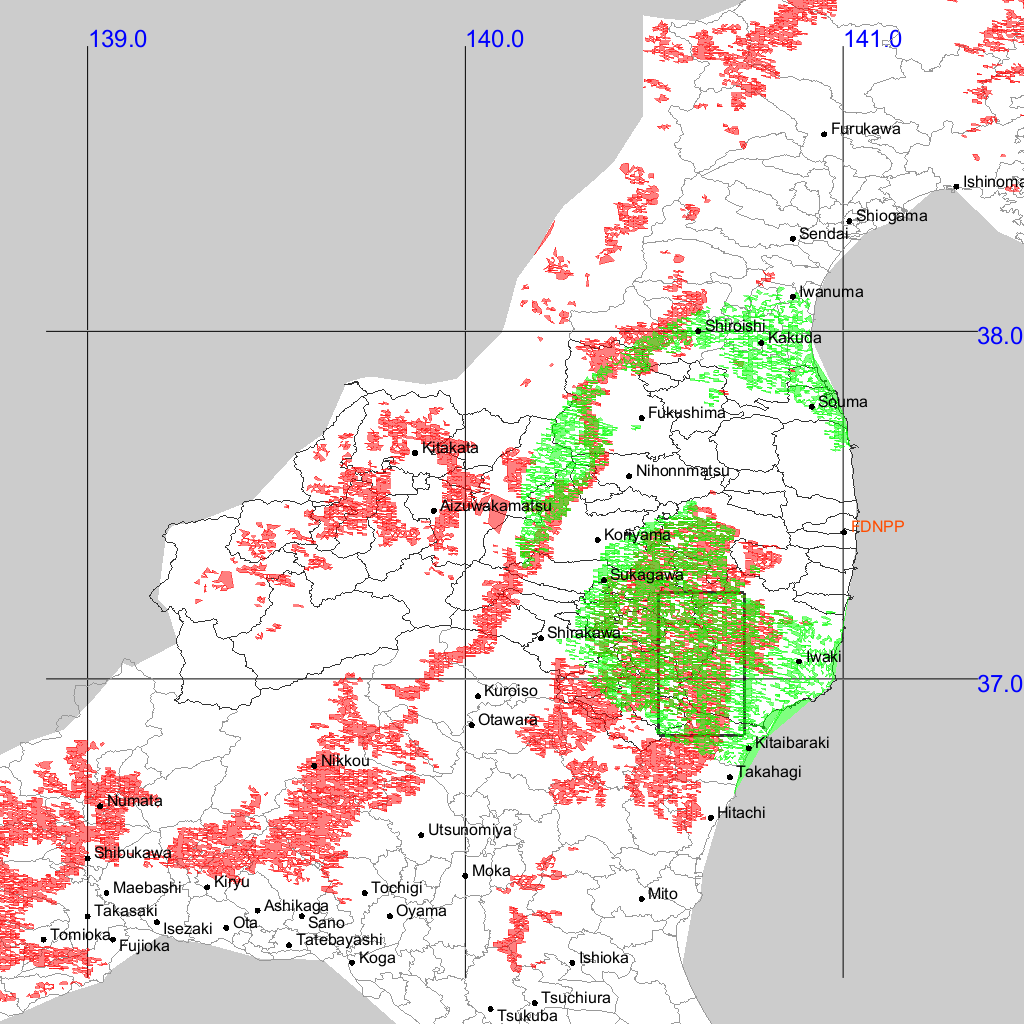
Fig. 1 shows the system we implemented for this study, which allows interactive visual analysis of the relationship between dose rate and other attribute values.
The attribute values being analyzed here are P: dose rate, Q: altitude, and R: distance from the nuclear power plant.
The arrows in the figure show the correspondence between the scatter plot on the left and the map on the right.
|
|
|
Fig. 1:
This figure shows the relationship between the area around the Fukushima nuclear power plant and three attribute values.
The attribute values are P: dose rate, Q: altitude, and R: distance from the nuclear power plant.
The arrows indicate the correspondence between the scatter diagram on the left and the map on the
|
|
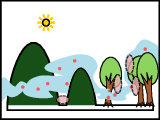
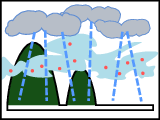
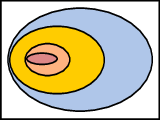
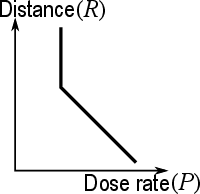
The dry deposition type corresponded to an area in which the radioactive material fell on terrain surfaces via turbulent flow and gravity precipitation, and thus the amount of the radioactive material was dependent on the altitude and complexity of terrain surface shapes, which often made the corresponding distribution randomly scattered and the hotspots relatively isolated (Fig. 2, left). In contrast, the wet deposition type occurred when the radioactive material was absorbed into rainfall and fell on an area, and thus, it is more likely to be uniformly distributed over the terrain surface regardless of the altitude (Fig. 2, right).
|
|
|
|
|
| Dry deposition | Wet deposition |
|
Fig. 2:
Dry (left) and wet (right) deposition processes of radioactive materials.
|
|
|
We projected the terrain surface onto a two-dimensional value domain space defined by two of the three attributes: air dose rate (P), altitude above ground level (Q), and distance from the Fukushima Daiichi Nuclear Power Plant (R).
The first task was to divide the two-dimensional value domain into regions with patterns specific to each type of dry and wet deposition.
In areas with dry deposition, radioactive materials are carried by air turbulence and may accumulate on the tops of mountains (see left of Fig. 2).
In addition, because radioactive materials can travel relatively long distances through the air, the amount of deposition does not correlate strongly with distance from the nuclear power plant.
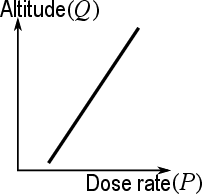
Typical profiles of data samples in the P-Q and P-R ranges are shown on the left of Figure 3.
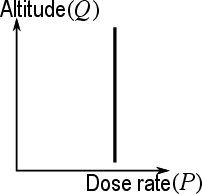
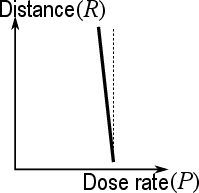
In contrast, in the wet deposition process, radioactive materials fall to the ground with rain, so the distribution is almost constant regardless of altitude (see right of Figure 2).
However, the likelihood of radioactive materials encountering rainfall while moving through the atmosphere is roughly proportional to the distance from the nuclear power plant.
This means that data samples in the wet deposition process area will show a specific pattern in the value domain space, as shown on the right of Figure 3.
|
|
|
|
|
| Dry deposition | Wet deposition |
|
Fig. 3:
Typical profiles of the projection of spatial multivariate data into a value domain space using the spatial dose rate (P), altitude (Q), and distance from the nuclear power plant (R) as attributes.
Dry deposition (left) and wet deposition (right).
|
|
|
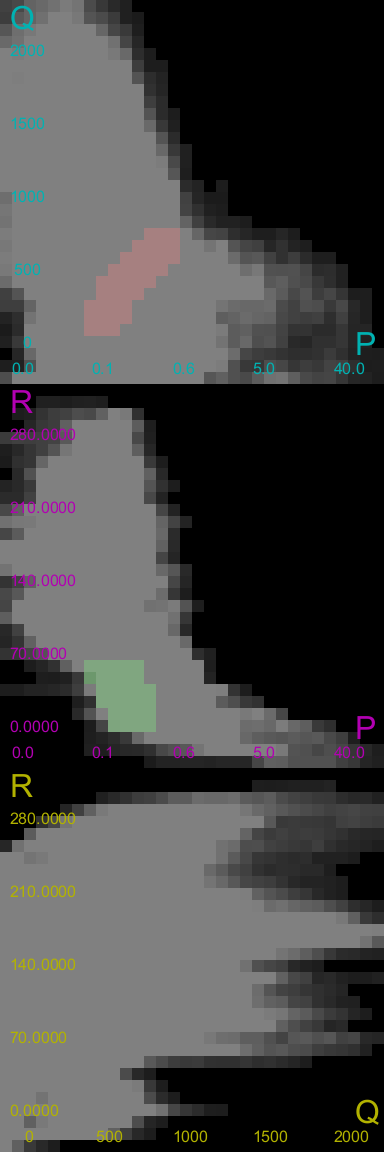
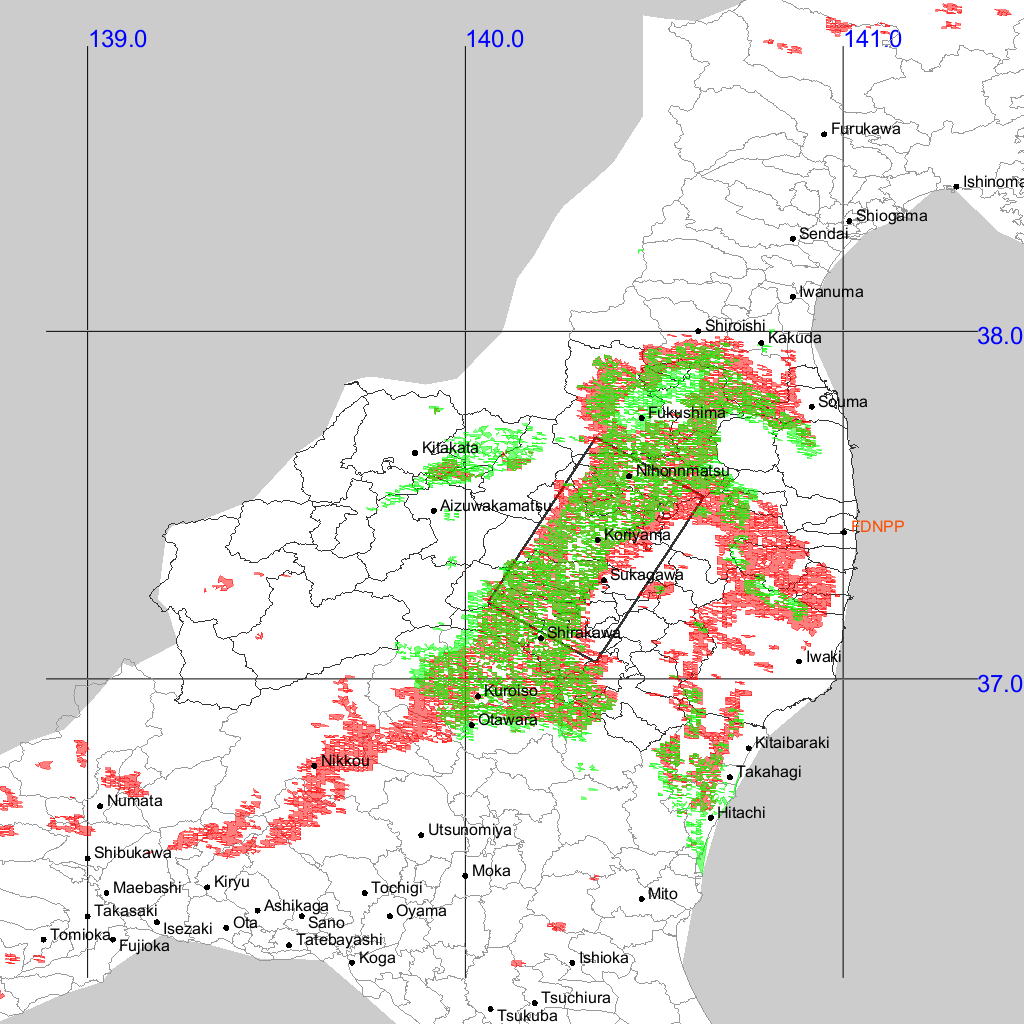
Fig. 4(a) shows an example of finding a region on the map that is likely to be a dry deposition type area.
In this example, we first filled in the pixels in each value range window while referring to the left side of Fig. 3, and then identified the areas that overlapped with the corresponding coloured areas on the map.
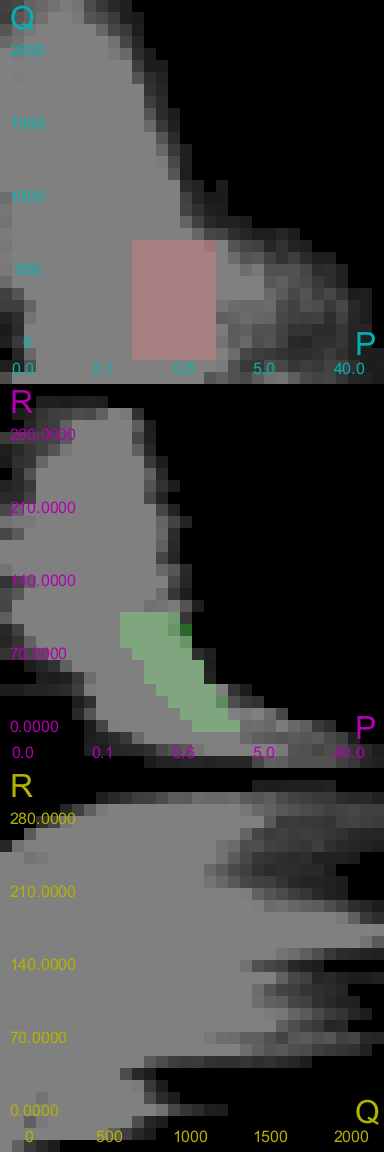
In contrast, the areas of wet deposition were identified by colouring the pixels corresponding to the profile on the right side of Fig. 3.
The area enclosed by the rectangle in Fig. 4(b) is the area of wet deposition obtained in this way.
In this way, we were able to classify the areas of specific deposition types by first drawing the corresponding typical patterns on the value range window based on known knowledge (Fig. 3), and then searching for the corresponding areas on the map area.
|
|
|
| (a) |
|
|
| (b) |
Fig. 4:
Classification of dry and wet deposition areas.
By drawing a specific pattern in the range window, it is possible to search for (a) dry and (b) wet deposition areas on a map of the area around the nuclear power plant.
|
Paper & VideoShigeo Takahashi, Daisuke Sakurai, Miyuki Sasaki, Hiroko N. Miyamura, and Yukihisa Sanada, Visual Analysis of Geospatial Multivariate Data for Investigating Radioactive Deposition Processes Visual Computer, Vol. 37, pp. 3039-3035, 2021., doi: 10.1007/s00371-021-02248-6 |